James Madison University - Department of Geology & Environmental Science
 Lynn S. Fichter
 Steve Baedke
 Eric Pyle
 Steve Whitmeyer
Teaching Chaos and Complex Evolutionary Systems Theories at the Introductory Level
Model: Increasing Instability:
Bifurcation Always Accompanied by
Bifurcation Diagram - Part 4 of 4 PartsStrategies and Rubrics for Teaching Chaos and Complex Systems Theories as Elaborating, Self-Organizing, and Fractionating Evolutionary Systems,
Fichter, Lynn S., Pyle, E.J., and Whitmeyer, S.J., 2010, Journal of Geoscience Education (in press)Description: People often express surprise when a system undergoes a sudden change. The 2008-2009 crash in the stock market is a recent example. Up to a few weeks before the system collapsed economists were saying the fundamentals were strong and the economy was doing just fine, and then it crashed. (Reinhart and Ragoff, 2009, demonstrate that the belief that economic change does not occur suddenly and unexpectedly has been true for at least the past 8 centuries.)
Similarly, until about a decade ago we generally believed climate change was gradualtaking thousands of yearsuntil ice core data demonstrated climate regimes can shift in less than a decade. On the other hand, people who understand the behavior of complex systems are not surprised by rapid changes. For example, a decade or two before the market crash, swings in the Dow Jones Industrial Average kept getting larger and larger. Often in real time we can detect when a system is approaching a bifurcation; its behavior begins to become more erratic.
Theoretically and conceptually this idea is better handled with Self Organized Criticality, but that comes a little later in the sequence.
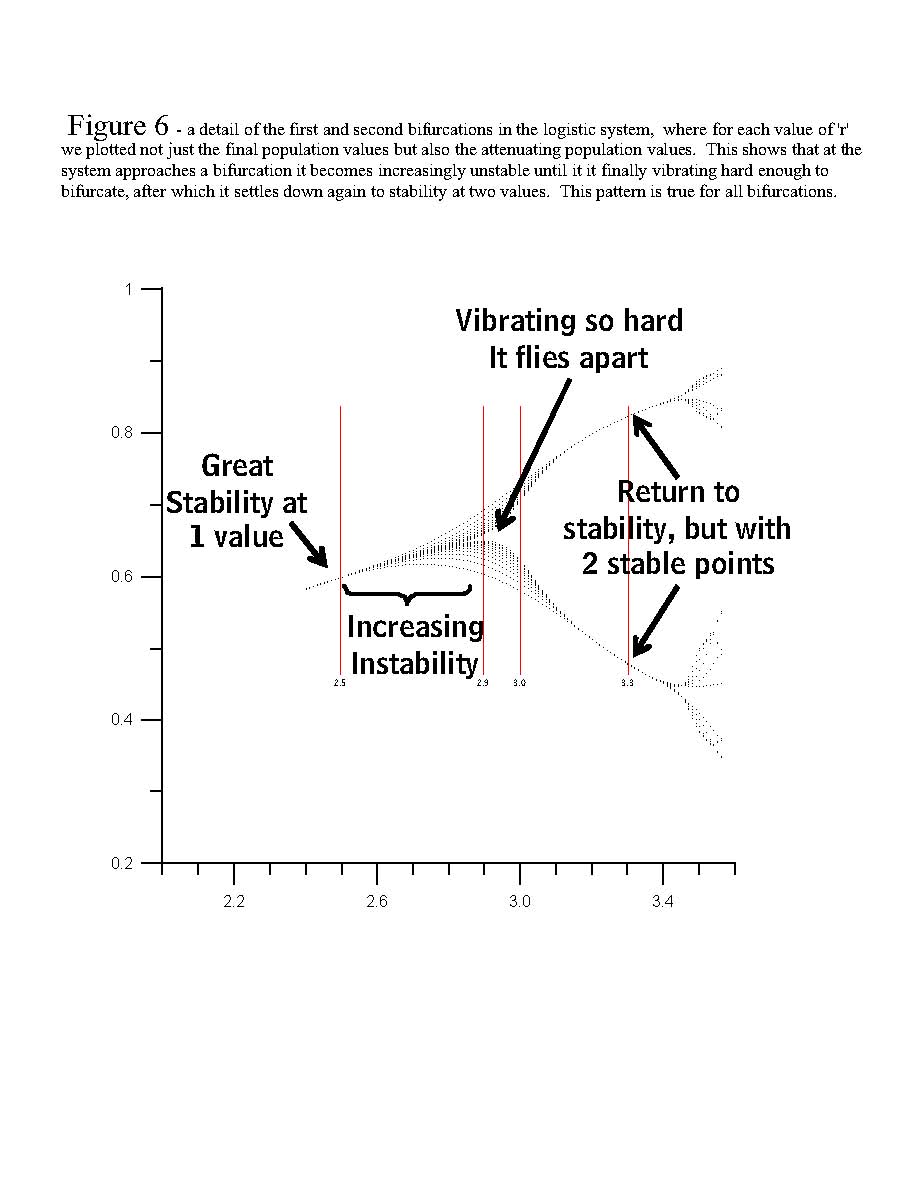
Presentation: Figure 6 is a detail of the first and second bifurcations in the logistic system, but instead of plotting only the last few population values, after the system had settled down as much as it was going to, we plotted a wider range of population values on the way to settling down. The result is, visually we can see that as a system approaches a bifurcation it goes from relative stability, to increasing swings, to splitting, to settling down in the new state. The concept can be grasped visually, and takes about 5 minutes to present (Power Point).
Anticipated Learning Outcome:
- 11. All changesbifurcationsin a system are preceded by increasing instability in the behavior of the system. After splitting the system settles down toward stability again.
Power Point
Figure 6 - Zooming in on the Bifurcation Diagram