|
A tropical storm that was approaching the Eastern Shore strongly affected the entire estuary ecosystem and therefore altered our collection of data from what we would expect to find if a storm was not in the area. Tropical storms are common in this area in the late summer and early fall so the data that we were collecting did not deviate from what we would expect to find in early October of another year. The salinity within the water columns did not vary significantly with depth. The tropical storm affected the profile of the water column by churning the water so that it is well balanced. Other than weather conditions, the main factors that affect the profile of the water column are the location with relation to the freshwater inlet and the tides. When we were collecting data the tide was ebbing between 8:00 a.m. and 9:00 a.m., but was flooding between 9:00 a.m. and 3:00 p.m.. This affected the salinity of the water. In the areas close to a freshwater inlet, at high tide the salinity would be less than at low tide because at high tide there was a larger quantity of salt water that was being mixed with a relatively constant flow of fresh water. For this reason, the salinity values that were taken at the inlet (site one) are the lowest [31.3 ppm to 31.5 ppm], and the salinity values at Nickawompas Creek (Site three) were the highest [32.1 ppm]. The midway location (site two) had salinity values [31.5 ppm to 31.6 ppm] that were in between those at the inlet and at Nichawompas Creek. |
|
SALINITY |
|
TEMPERATURE |
|
Sites one and two which were located further away from the freshwater inlet both did not vary in depth and were about 23.6 degrees Celsius. Both of these values are in deeper water that have been well mixed. However, at site three the range of temperatures was much higher [25.5 to 24.3 degrees Celsius] and the temperature varied within the upper two meters of the water column. The warmest values were at the surface while the coldest were lower in the water column. |
|
DISSOLVED OXYGEN |
|
For each site, the dissolved oxygen levels at the surface were higher than they were between one half meter and one meter below the surface. Even further down in the water column, the dissolved oxygen levels were approximately the same as those at the surface. The dissolved oxygen levels at sties one and two ranged between 5.4 mg/L and 6.0 mg/L. However, at site three the dissolved oxygen level was much lower and ranged between 4.5 mg/L and 4.9 mg/L. Having lower levels at site three which is closest to where the fresh water enters the estuary indicates that something upstream is making the dissolved oxygen levels lower. If the dissolved oxygen levels for the stream are lower than normal it would suggest that the D.O. is being used up faster than it is being added to the stream. To find out more about the dissolved oxygen levels in this area it we would need to take D.O . Samples further up stream as well as during different times of the year. |
|
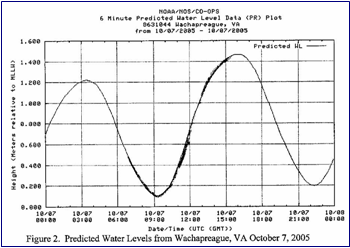
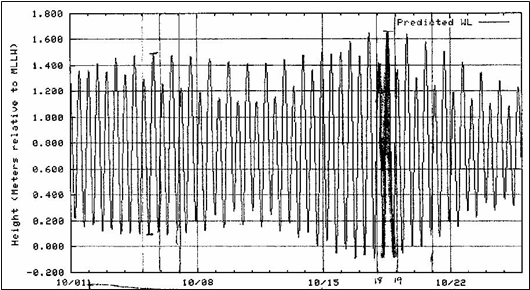
NOAA/NOS/CO-OPS 6-minute Predicted Water Level Data (PR) Plot 8631044 Wachapreague, VA From 10/01/2005 |