| Sed.Home | Alph | Intro | BasicClass | QFLClass | Keys | Depo.Envir | Evol | Evol.Model | Sed.Tect | Self Tests |
Reading a Ternary Diagram
And Creating Rock Names
And Creating Rock Names
Need to plot ternary data? A free plotting program is available: TriPlot.
Power Point presentation animating How to Read a Ternary Diagram and applying it to clastic rock classification and identification.
This PP is one I use in my introductory general education and historical geology classes and is unmodified from them. Anyone may use any of the slides for personal or educational purposes so long as the source is acknowledged. Questions? Comments. Contact me at fichtels@jmu.edu.
This PP is one I use in my introductory general education and historical geology classes and is unmodified from them. Anyone may use any of the slides for personal or educational purposes so long as the source is acknowledged. Questions? Comments. Contact me at fichtels@jmu.edu.
Reading a Ternary Diagram
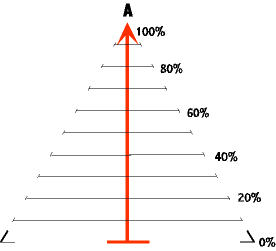
A ternary diagram is a triangle, with each of the three apexes representing a composition, such as sandstone, shale, and limestone . For the moment they are labeled A, B, and C. We are going to take the diagram apart to see how it works. The drawing to the left has only the skeleton of the triangle present as we concentrate on point A. Point A is at the top of the heavy vertical red line (arrow). Along this line is indicated percent of A. A point plotted at the top of the vertical line nearest A indicates 100% A. A horizontal bar at the bottom of the line (farthest from A) represents 0% of A. Any other percentage can be indicated by a line appropriately located along the line between 0% and 100%, as shown by the numbers off to the right.
The horizontal lines that represent various percents of A can be of any length since they run parallel to the base line and remain the same distance from the bottom and top of the triangle. The lines are projected out to the right of the red arrow line just as far as where the imaginary side of the triangle will be, and their percentage abundances written along the right side of the triangle. By doing this the right side of the triangle becomes the scale for percent abundance of A.
To be complete the hoirizontal lines also extend to the left until they contact the left side of the imaginary triangle, but no percent abundances are written there. In the final ternary diagram the red vertical arrow is removed.
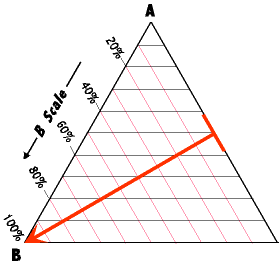
 Point B is at the lower left apex of the triangle. We construct a percent abundance scale for B by rotating the heavy red scale line 120 degrees counter clock wise so that it runs from the right side of the triangle to the lower left corner. The right side of the triangle now becomes the base line for the percent scale for B, and a series of red lines have been drawn parallel to the triangle's right side to mark off the percentages. These lines are projected out to the left and bottom sides of the triangle, and the percent scale for B laid out along the left side.
 Point C is at the lower right apex of the triangle. We construct the percent abundance scale for C by rotating the heavy red scale line another 120 degrees so that it runs from the left side of the triangle to the lower right corner, and the percent scale lines and percent abundance numbers rotate with it.
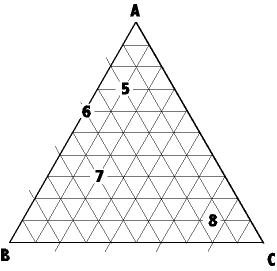
 The sum result is the ternary diagram to the right with all the scales present. Note that the heavy red lines are not included in this final triangle. Also observe that the ternary diagram is read counter clockwise.
So, some practice. Note the numbers 1 - 4 on the diagram. The composition for each of these points is shown below. See if you agree.
1. 60% A | 20% B | 20% C = 100%
2. 25% A | 40% B | 35% C = 100%
3. 10% A | 70% B | 20% C = 100%
4. 0.0% A | 25% B | 75% C = 100%
However, in common use, ternary diagrams usually do not have the "A Scale", "B Scale", "C Scale" on them. Also, even the percent numbers are absent. So, you must learn to read these diagrams without all those aids.
 So, determine the percent abundances for each of the following points.
5. ? % A | ? % B | ? % C = 100%
6. ? % A | ? % B | ? % C = 100%
7. ? % A | ? % B | ? % C = 100%
8. ? % A | ? % B | ? % C = 100%
Click here for Answers:
Naming Rocks From the Ternary Diagram
One of the criteria of a good classification system is that rock names are logically and consistently derived so that one may easily and accurately go back and forth from diagram to rock name. We will later develop more sophisticated rock names, but let's begin with the rocks developed in the simple ideal model.
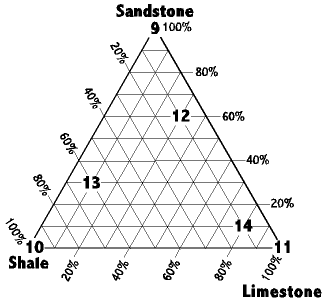
 Notice that the simple ideal model has three attractors - sandstone, shale, and limestone. And, of course, a ternary diagram has three apexes. So, sandstone goes at the top, shale in the lower left, and limestone in the lower right.
Samples 9, 10, and 11 are at the apexes of the triangle and so each of these are pure end members, just as in the simple ideal model. However, any point that plots anywhere on one of the side lines, or within the triangle represents a rock composed of mixed end members.
That such mixed specimens exist should not be surprising, even from the model. Observe in the drawing above that sandstone shades into shale, and shale shades into limestone.
The question here is, how would we name such rocks if we wanted to give them names? After all, saying something like "60% sand 30% shale, 10% limestone" for every rock would get tedious, and we would have to visualize the ternary diagram and plot the numbers to get a true sense of the rock.
But take a rock like 12. It has the following composition:
12. 60% Sandstone | 10% Shale | 30% Limestone = 100%
Give this rock a name that you think is logical. Answer