 |
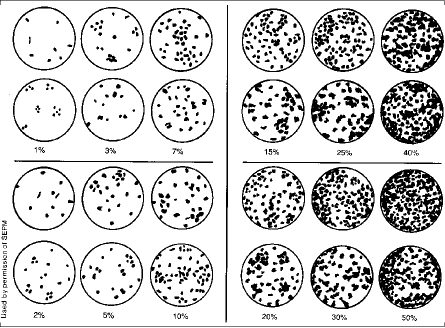
The percent abundance chart helps to estimate how much of each mineral is present in a rock. Imagine each circle equals 100%; the black spots then equal the percent written under each circle. There are a few strategies that are helpful. Begin with dark minerals; they are easier to see. Begin with the least abundant minerals; they are easier to estimate. Also, observe that a 50% abundance looks like a lot more than 50%. In this case dark minerals are easier for the eye to see and so we tend to overestimate them. Finally, make sure all your estimates add up to 100% plus or minus. |