| Ig. Home | Simp.Class. | Advanc.Class. | Alpha.List | Bowen's Reac.Srs. | ID Keys | Extrus/Intrus | Tect. | Self Tests |
|
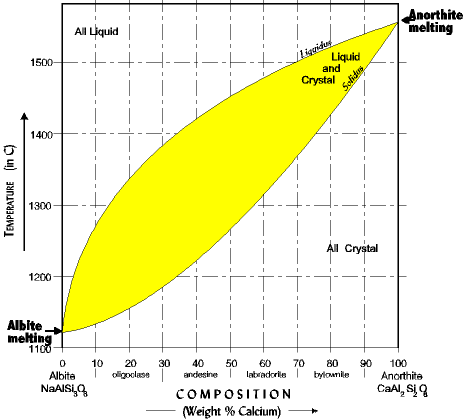
The solid solution phase diagram explains the behavior of chemical solid solution series, such as the transition from high temperature, calcium-rich plagioclase to low temperature sodium-rich plagioclase, or the transition from high temperature magnesium-rich to low temperature iron-rich crystals in ferromagnesium minerals (e.g. olivine, pyroxene). The example here is for the plagioclase feldspars. We want to observe the behavior of plagioclase under two conditions, one of complete equilibrium during crystallization, and the second of disequilibrium when fractionation occurs and igneous rocks evolve. The conventions for the phase diagram include the following (illustration below): NOTE that anorthite crystallizes at a much higher temperature than albite, just what we expect from Bowen's reaction series. The larger Ca (99A) is higher/hotter than the smaller Na (95A). The assumptions are: |
Organization of the Solid Solution Phase Diagram |
|
| NOTE the following about reading the diagram: 1. Low temperature, sodic plagioclase (Albite) is on the left; high temperature calcic plagioclase (anorthite) is on the right. 2. Composition is in percent anorthite. A 30% anorthite has 30% calcium and 70% sodium. 3. The diagram is divided into three fields, all liquid, liquid + crystal, all crystal. The liquidus line separates the *all liquid* phase from the *liquid+crystal* phase. The solidus line separates the *liquid+crystal* phase from the *all crystal* phase. The solidus and liquidus lines are experimental, they have been determined by melting and cooling many melts at different percents anorthite. |
 |
An Example of Equilibrium Crystallization From a Melt> |
|
| The First Crystal (numbers on phase diagram correspond with numbers below) 1. As an example, begin with a hot melt of 30% anorthite. 2. Cool melt to liquidus line. First crystal begins to form at about 1380o. 3. To determine the composition of the first crystal move horizontally across the diagram to the solidus line. The solidus always indicates crystal composition. 4. Then drop from the solidus straight down to the bottom scale. The first crystal is 72% anorthite. The diagram is always read in this manner, *down-across-down* regardless of starting composition. |
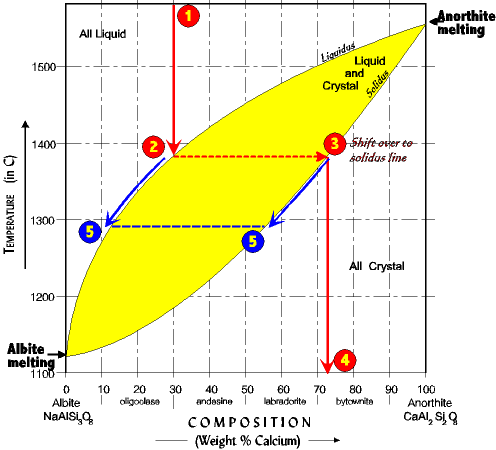 |
| But observe, as crystallization continues Ca is removed from the melt faster than Na (a 30% melt yields a first crystal not at 30% but at 72%.) As a result as crystallization proceeds Na concentration gets higher in the melt and Ca gets lower. 5. Thus, as the temperature lowers the composition of the melt migrates down the liquidus line. But at the same time the composition of the crystals forming are moving down the solidus line (that is, decreasing in Ca.) This is because the system cools slowly enough to stay in equilibrium at all times. The earlier formed crystals react with the melt, exchanging Ca for Na, to come to a composition in equilibrium with the temperature at the moment. The composition of the melt and crystals move down in tandem, exactly opposite each other along a horizontal line. What will be the composition of the last drop of melt? And at what temperature? Answers. |
An Example of Equilibrium Melting of a Rock |
|
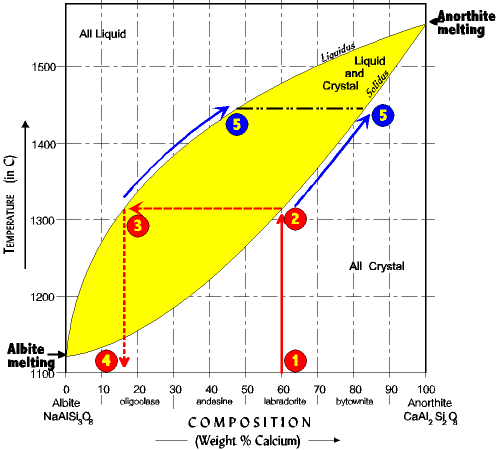
| We can reverse the process and begin with a rock, heating it slowly until it melts. In this case the diagram is read *up-across-down* (following the numbers. 1. Begin with an original composition of 60% anorthite. 2. Heat the rock until it hits the solidus line. Here the first drop of liquid appears as the rock starts to melt. 3. To find the composition of the first melt draw a ling straight across horizontally to the liquidus line. If you keep going to the temperature scale it will give you the temperature the first crystal melts, here about 1310o. 4. Now drop straight down from the liquidus line to the composition scale at the bottom and read the composition of the first drop. It is about 16% anorthite. Observe that the first drop of melt is always more Na rich than the original crystal. |
 |
|
As heating continues more crystal will melt but at ever higher Ca compositions. This is because as the temperature rises the higher Ca crystals are the ones becoming more unstable, and thus melting. Actually, entire crystals are not melting so much as the more Na-rich fractions of the crystal melt first. 5. And just as with crystallization, during melting the melt composition and crystal composition will move in tandem horizontally across from each other, but this time up the solidus and liquidus lines until all the crystal is melted. At the point no crystal is left the line moves straight up the graph as temperature continues to rise. See if you understand. |
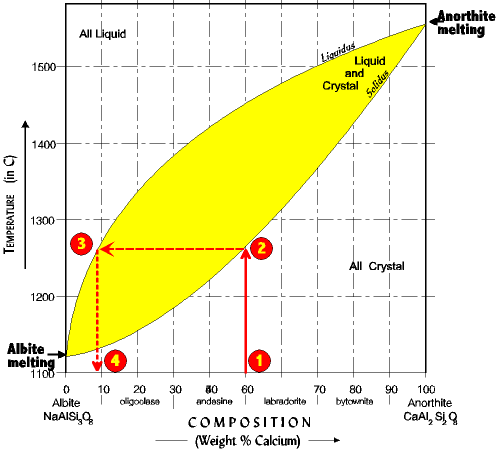
Fractionation: Changing the Rules Melting or crystallization under equilibrium conditions is not very interesting - you always end up with what you start. No evolution there, and what good is an open system if it will not evolve? But real systems often do not remain in equilibrium. As an example of how a solid solution mineral undergoes chemical fractionation by melting, examine the phase diagram below. |
An Example of Fractional Melting |
|
| 1. Imagine a plagioclase crystal which is 50 % anorthite (50% Ca and 50% Na). It is slowly heated until it begins to melt. The crystal does not melt uniformly. Rather the Na rich fraction (lower in the reaction series) begins melting before the Ca rich fraction (higher in the reaction series). 2. The composition of the first melt is found by drawing a vertical line up to the solidus line (at about 1260o). . . 3. Then across to the liquidus line . . . 4. And back down to find the composition of the first melt, about 9% anorthite (91% albite). |
 |
|
Now imagine that this first melt is removed from the system so it can no longer react. We have divided the original composition (50% anorthite) into two fractions, a Na rich melt (about 9% anorthite) and a slightly Na impoverished crystal (about 49% anorthite.) We could, of course, separate the melt from the unmelted crystal at any time during the process before the last bit of crystal melts, and fractionated the system. In each case, one fraction would be more Na rich than what we began with, and the second fraction would be more Ca rich. See if you understand. Fractional Crystallization Fractionation can also occur from fractional crystallization. As with fractional melting what is required is separating the crystal from the melt before complete crystallization has occurred. Give it a try, but remember you must start at the top and zig-zag your way down. |
| Last Update: 9/29/00 | e-mail: (Fichtels@jmu.edu) |