 We have mentioned a few times that geology is fractal. We want to illustrate what this means by looking at an example of Alleghanian structural deformation. This is done by examining structural features at many scales along the cross-section line on the index map to the right. The cross section runs from the Valley and Ridge, across the Blue Ridge, and into the Piedmont. This cross section is one we have used many times already (reproduced below), but now we want to dissect it, and look at its parts in more detail.
When a figure is fractal it means that regardless of the scale of observation, no matter how much we enlarge the feature and look more closely, rich detail will continue to emerge. This "fractal" concept not only applies to our artistic depiction of the rock record, but, more importantly, is observed within the actual rock record, both structurally and stratigraphically. The best example is the Mandelbrot set; go there and try it (link 1 [images[, link-2 [allows you to zoom in on the set[, link-3 [explores parts of the set], Link-4 [more mathematical descriptions], or go Here for lots of links.) What fractal also means is that typically with less magnification you cannot see many, if any, of the details seen at greater magnifications. They are just too small to show up until you magnify the image. This can be understood if you think of looking at something through a microscope, say an insect wing. At high magnifications many details come out that you just can't see without the microscope. You may also have experienced this if you have ever traced a somewhat complex drawing. Over and over you have to decide whether you are going to follow all the little squiggles, or just pass over them with an average line. The implication is, every "line" in nature is not simple. Blow it up and you will see new detail, and if you blow up a segment of that line it will reveal even newer detail, ad infinitum. The same thing is true when we draw geologic structures. We always have to decide just what to include and what to leave out. Often this decision is an individual judgement of what is really important, and what is not. In any event, at the outset you might be inclined to think that the cross-section below is an accurate reflection of the geology in the area. But the drawing is not accurate. It is a selected image, drawn for a specific purpose, and it includes only those things that are germane to that purpose.    Gathright and Frischmann The major difference between these examples is that the main cross-section was drawn to make a point about foreland basins in the Taconic orogeny, and so just the main faults were important. But the Box One cross section was drawn specifically to highlight the structural geology in the region, and since structure was most important the authors strove to be as complete and accurate as they could; that is, show the detail. If we were to try to put all the structures from Box One in the main cross-section we would first of all find it very difficult; we just could not easily capture the details at that larger scale. Also, they would make the main cross section so busy it would be hard to read, and thereby less useful. Of course, the natural question to ask is which is the most correct cross-section. We might be inclined to think that the more detailed one is more correct, but that is not necessarily so. What if we were to take a small part of the cross section in Box One and enlarge it to see more of the fractal detail. Would even more detail emerge? Almost surely! And that detail might tell us the Box One cross section is no more accurate than the main one; more detailed, yes, but not necessarily more accurate. Accuracy then becomes a matter of definition, and a cross section that is accurate at one scale, or for one purpose may not be accurate at another scale or for another purpose. Box Two is an enlargement of the eastern part of the main cross-section. Notice in the main cross-section that the portion labeled Blue Ridge Overthrust just looks like one big sheet of rock that had moved west along a fault. Nothing could be further from the truth. The Blue Ridge and Piedmont provinces are filled with faults or zones of weakness, of all ages, including those that are Grenville, Taconic, and Alleghanian age.  In fact, when you look at the cross-section for Box Two you will notice that there are so many faults packed together that, based on the faults alone, it is really not possible to distinguish between the Piedmont and Blue Ridge Provinces. We distinguish these provinces because the rocks that make them up are so very different, but structurally there is little reason to separate them. They all verge westward, and were all produced during the Alleghanian orogeny, and that is what is centrally important about them. 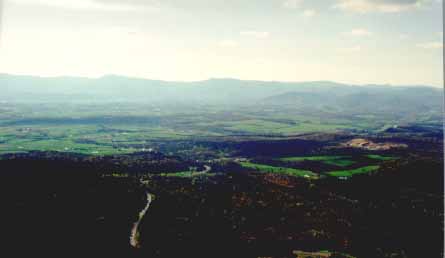 This is the example we used on the main page as the boundary from the Blue Ridge to the Valley and Ridge Province (go there). The same picture is to the right, where we are looking east from Massanutten Mountain across Page Valley. Note the Blue Ridge Mountains (province) in the distance, and Page Valley (Valley and Ridge province) in the foreground. Remember that the Blue Ridge fault runs at the base of the Blue Ridge Mountains, that is, at the boundary between the provinces, as seen in this cross section.
 We have implied in every cross-section we have used that the Blue Ridge fault is a single, long, continuous fault. But that is not true: it is a series of faults, sometimes splitting and coming together, and sometimes running separate from each other. Indeed, some of these faults will be completely different faults; Box Two. Thus, the closer we get to the fault, the more detail we include, and the more closely we map and draw it, the more complex the fault becomes. And if we go to the cross section in Box Two it should be clear that the Blue Ridge fault is also just one in a very large complex of faults, all related in one way or another. In fractal images this is usually the case, it is hard to say what is important and what is not important since all the features are related in some fashion. The large scale reflects the details, and the details construct the large scale. So what is important about the Blue Ridge Fault? The fact that it is the farthest western fault along which the Blue Ridge/Piedmont rocks slid? Or, the fact that it is, in fact, a bunch of smaller faults some of which may be different faults altogether? Or, that where it occurs it represents the boundary between two provinces? The conclusion is, something becomes important only because we make it important; nature does not recognize these distinctions. 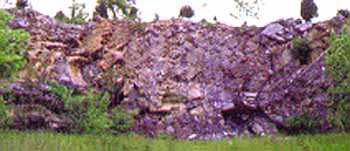 The area of Box Four lies west of the Blue Ridge. It is in a small quarry along the Shenandoah river, about half a mile from Rt. 211. The quarry is quite visually and geologically stunning. It shows a recumbent fold; a fold laying down on its side with a near horizontal axial plane.
 For such a fold to develop, horizontal rocks must be arched up into an anticline, and then folded over until the whole arch is laying down flat on its side. The process is seen in the drawings below. To the right is the anticline; the vertical blue line is the axial plane that divides the fold into two more or less equal halves. Notice as the drawings go from right to left the axial plane lays over more and more until it is horizontal - this defines a recumbent fold, as in the quarry picture above right. The overturned nature can be best seen on the right side of the quarry, but the axial plain runs horizontally across the middle of the quarry.  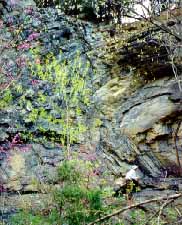 The picture to the right is a detail of the right side of the quarry where it is easier to see the nature of the fold (not the person in the white shirt toward the bottom right.
But now go back to the main cross section. Box Four lies within the southeast limb of the Massanutten Syncline, and there is little hint of other folds in that drawing. But it is there, as we can see in the quarry. Two things stand out from this. One is that there are folds within folds. Here a smaller overturned fold within a larger synclinal fold. This is the very nature of a fractal image. The second thing is that if this small recumbent fold is there, exposed within the larger syncline, you can be sure there is a lot of other complex folds associated with the syncline. Other anticlines and synclines of all scales that we cannot see. So, which fold is important? Perhaps the best answer is the one we are studying at the moment, because at some level they are all important. 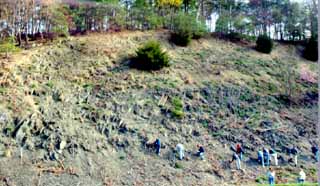 The structure in this box is located along Rt 211 on the eastern side of Massanutten Mountain, where Rt 340 and Rt 211 join. It is a large noticeable road cut. Notice in the picture that the rocks from the southeast limb of the syncline are dipping toward the left, which is west. This would make sense in a syncline; rocks on the two flanks dip toward the center. The diagrammatic cross-section of Massanutten mountain below shows with the red arrows how the rocks dip toward the center. Looking northward, down the axis of the syncline (that is, into the screen) the right side dips toward the west, the left side dips toward the east.
 What we really want to do though, is get closer to individual rocks, as in the next two pictures. They were taken about half way up the outcrop, near the center of the exposure. Both photos contain alternating sandstone and shale beds. These are the individual depositional units. Notice that there are diagonal lineations running through the beds. These diagonal lineations are not part of the original sedimentary rock. They represent a shear structure called cleavage, small aligned, closely spaced fractures developed when the rock folded to form the Massanutten Syncline during the Alleghanian orogeny. 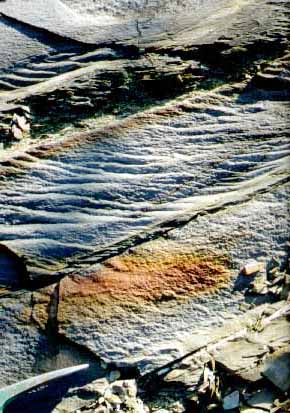
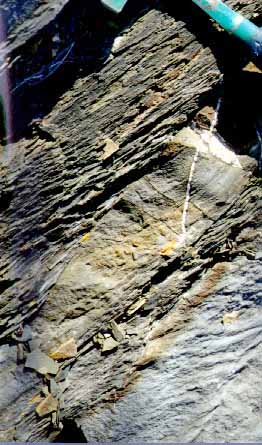
To see how this works examine the drawings below. In the top drawing are two sandstone beds, in yellow, above and below a brown shale. Vertical lines have been drawn through the shale as references. When the rocks are folding, stress causes one side to move in one direction while the opposite side moves in the opposite direction as shown by the red arrows. The large scale folding in which this takes place can be seen in the middle drawing where a stack of sandstone and shale has been folded into a syncline (the larger beds in the upper drawing are located in the small box in the folded stack of beds.) This kind of shear behavior is seen if you bend a stack of paper, or a magazine. Sheets of paper that originally had their edges lined up get shifted so they no longer line up.  But rocks are solid objects, not sheets of paper. So when the strain of folding forces them to move like this the rock itself absorbs the shear as diagonal cleavages running at an angle to the bedding. This can be seen in the lower right drawing where the lines representing cleavage that were originally at right angles to the bedding have become diagonal lines running through the beds. The real cleavage lines can be see in the rocks in the photographs above.
 The conclusion is, even at this small scale the rock is fracturing. When rocks fold and fault not only do the large structures appear, but also the small ones, and even the microscopic ones. The shear structures (cleavages), in fact, trend parallel to the axial plane of the main fold (see discussion under Box Four) and so through the small cleavage seen in these rocks we also see reflected the deformation that produced the main fold. Conclusions The conclusions we draw from these examples are several. One, of course, is that the rock record is fractal, meaning there are structures, within structures, within structures, from the microscopic to the mega scopic. Two, all these structures are intimately related, the little is contained within the big, and the big is implied in the little. This means they are likely all be the result of processes operating under the same stress regime. Three, any time you see small structures, like those in a quarry or roadcut, they are generally part of a much larger structure. The Appalachian mountains we see today can seem enormous. Standing at the bottom of the Blue Ridge Mountains, or Massanutten Mountain, or Old Rag Mountain, or the Allegheny Front one may easily feel dwarfed, and find it difficult to imagine that what we see are only the remains of structures that were at one time vastly bigger. But, the tops of the present Appalachian Mountains at around 4000 feet elevation are in fact the eroded remnants of mountains that were likely the size of the modern Himalayas, standing today at nearly 30,000 feet. Still, standing by a road cut viewing a fold much bigger than we are, it is hard to imagine that the fold may be only one small part of a much larger fold, which, if complete, would extend many thousands of feet upward beyond the tops of the present mountains, or descend thousands of feet below into the earth. Yet looking at the examples above clearly shows that geologic structural processes are fractal in nature, and that even seeming large structures may just be parts of even larger structures. The world astonishes us at the microscopic, and dwarfs us in the mega scopic. To appreciate it we must learn to "see the world in a grain of sand" and the mountain in the outcrop.
|